Linear mixed models – What is non-independent data?

Linear mixed models – also called linear mixed-effects models or hierarchical models – are statistical models that extend ordinary linear regression to situations where data points are not independent of each other. What do we mean by this?
Examples of non-independent data
Hierarchy in data
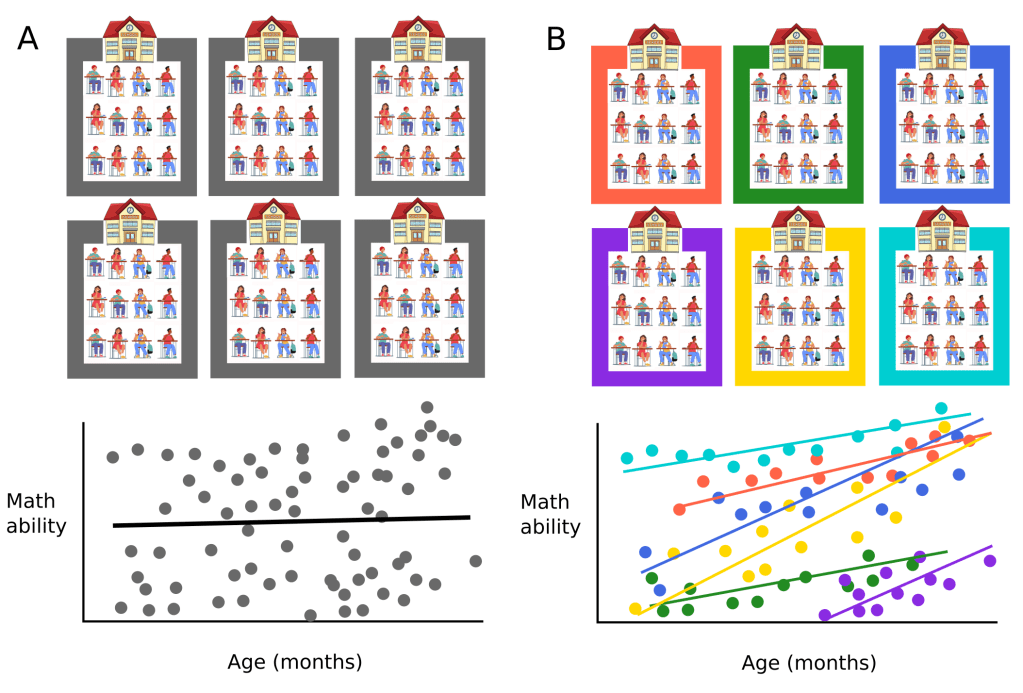
Schools, students and maths. Imagine we were trying to determine whether a student’s age in months impacts their maths ability. Could it be that students that are 8 years and 6 months old at the start of 3rd grade have better maths ability than students that who were exactly 8 years old at the start of the study? To answer this question, we might randomly select several schools from our district and have students perform a maths tests. As we can see in Figure 1A, if we lump all the students together, disregarding that they attend different school, there appears to be a slight effect of ages in months and maths ability.
However, as many people are aware, certain schools fare better at maths than others. This could be because they have an excellent maths teacher, or the socioeconomic background of their students are different to those of students who attend a different school in the district. The key point is that the maths ability of students from the same school are more likely to be similar to one another; in this way, it can be said that they are not entirely independent. This is illustrated in Figure 1B. If we look at maths ability within a school, on average, there seems to be a stronger effect of age in months (i.e. the slope of the coloured regression lines are steeper) than the effect we observed when all the students were lumped together.
There can be multiple levels to this hierarchy. For example, if we decided to test year 3 students from different classes in the same school, and randomly selected 10 different schools in the district, we might expect students that have the same teacher to be somewhat more similar in their maths ability compared to students from another class in the same school that have a different teacher (maybe this teacher has an allergy to maths and, subconsciously, they have transmitted it to their students!). But, like our prior example, we also expect students from the same school to be more similar compared to students from a different school. Thus, students are nested in classrooms, which are nested with schools.
If you read books and tutorials on linear mixed models, you will definitely come across a version of this school example. While intuitive, the school example is far removed from the type of research I do. So, what types of hierarchies are there in the biomedical sciences?
Mice from the same litter.
A first example is animal experiments. As depicted in Figure 2A, it is possible that we are studying the effect of salt intake on blood pressure (yes, we use miniature blood pressure cuffs, very cute!). To complete this study, we recruited 15 healthy mice from the local community. But, the 15 mice are not truly independent from one another. They are three groups of five litter mates; that is, three groups of brother and sisters. Given that there is a strong genetic influence on how salt impacts blood pressure, mice from the same litter will be more similar than mice from different parents.
Motor units from the same muscle.
As a second example, researchers may want to record motor units because they provide information on the discharge activity of a motoneuron located in the spinal cord that innervates a given set of muscle fibres. Historically, this was a difficult and invasive procedure, requiring needle or fine-wire electrodes to be inserted into the muscle. As can be seen in Figure 2B, these types of recordings could be used to identify the unique shape of a motor unit – its motor unit action potential – and track its activity over time. At times, more than one motor unit could be identified at the same time. Alternatively, the recording electrode could be moved to a new location in the muscle and new motor units recorded. A modern solution is to use a grid of several dozen surface electrodes and use sophisticated algorithms to extract the discharge activity of the motor units contributing to the multi-unit surface recordings. As can be seen in Figure 2C, grid electrodes can capture the activity of dozens of motor units simultaneously.
However, motor units recorded from the same participant, whether from an indwelling recording electrode that was repeatedly moved throughout the experiment or a grid electrode, are not entirely dependent from one another.
Human motoneurons receive input from a variety of sources. One of these sources, called common drive, is an excitatory motor input that is common to a given motoneuron pool. Because of this and other common inputs,
motor units recorded from one participant are more likely to be similar to one another than motor units recorded from different participants.
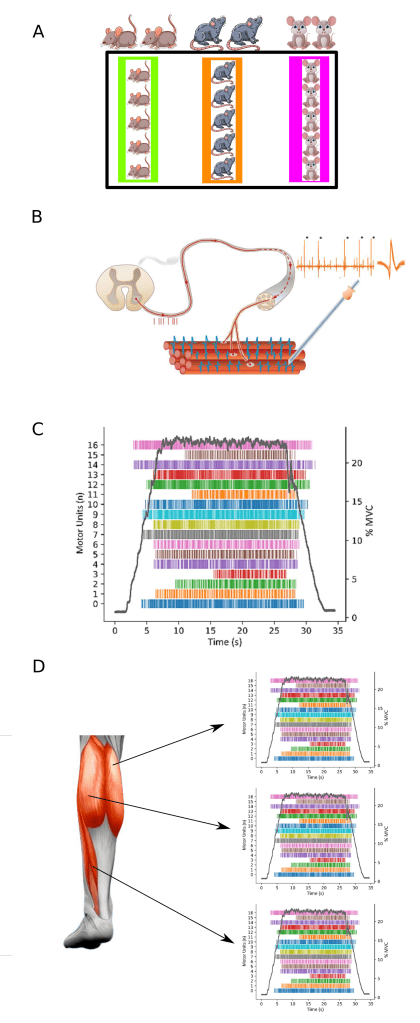
In fact, because different muscles receive different excitatory and inhibitory inputs, there is also the possibility of having additional hierarchies, similar to our student-teaching-school example. Thus, as illustrated in Figure 2D, it would not be unreasonable to expect that motor units recorded from the same muscle (e.g. medial gastrocnemius muscle) to be more similar in discharge activity than motor units from another muscle (e.g. soleus muscle).
Repeated-measures and longitudinal data
Experimental study. We have discovered that maple syrup has important anti-ageing properties. Thus, we devise a study where 100 volunteers are to bathe for 15 min a day for 5 years in maple syrup. The primary outcome of the study is telomere length, a cellular/genetic marker of age. Nothing has been found that can halt the shortening of telomere length, let alone reverse it. This outcome was measured at baseline and after 5 years of daily sweet bathes (and in case you were wondering, yes, they could change the bathe syrup every week). As can be seen in Figure 3A, maple syrup bathes actually resulted in telomere length to increase over the 5 year period; people were getting younger!
However, notice that a participant who had rather short telomere length at the start of the study also tended to be amongst the participants with the shortest telomeres at the end of the study (despite possibly lengthening somewhat over the 5-year period). The same can be said about participants who started the study with longer telomeres;
the also were amongst the participants with longer telomeres at the end of the study. What this illustrates is that knowing the participants telomere length at the start of the study provides some information about their telomere length at the end of the study. Thus, these paired data points, the ones from the same participant, are not independent.
Because of our amazing discovery regarding maple syrup, we decide to conduct another study were we ask participants to report the perceived weight of lifted objects, before and after taking a shot of maple syrup, and compare that to when they take a shot of water. To ensure we properly capture a participant’s performance,
we take 5 measures pre-shot and 5 measures post-shot. As can be seen in Figure 3B, each participant tends to answer the same thing on repeated trials for the ‘pre’ measures, and they also tend to answer the same thing on repeated trials for the ‘post’ measures. This makes sense: people tend to be internally consistent when making these types of judgements. Someone who feels the lifted object to feel like 20g on one lift is much more likely to provide a response close to 20g on another lift.
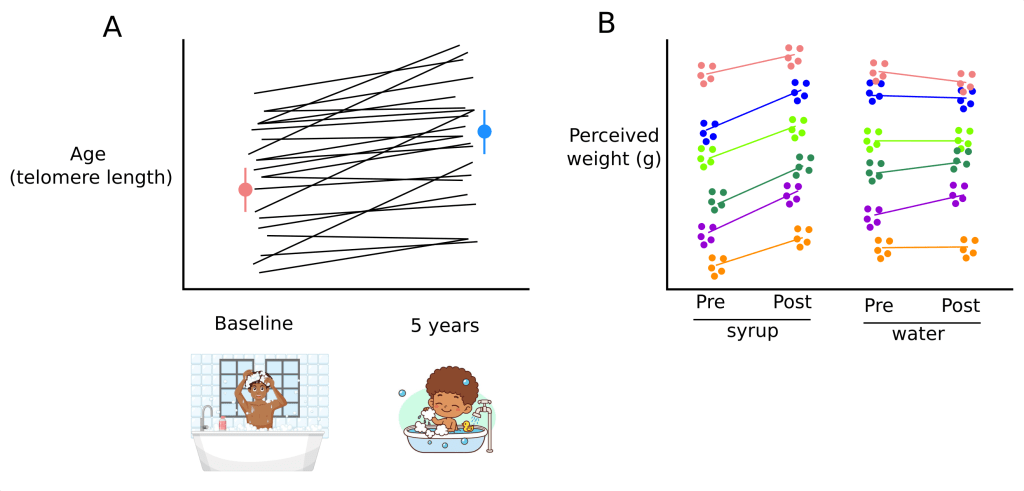
We can also see that a shot of maple syrup seems to make people report objects are heavier. But, as was the case for repeated trials at the ‘pre’ and ‘post’ time points, people who had higher ‘pre’ values also tended to have higher ‘post’ values. Thus, when analysing these data, we would have to account for the dependence of the multiple observations for a given participant at the ‘pre’ and ‘post’ periods, as well as the dependence between the ‘pre’ and ‘post’ observations within a given participant.
Longitudinal study. You can also have a study where you track a person over time, measuring one or more outcomes and various time points. Here again, measures made on the same individuals over time are not independent, and to properly analyse this data we must use an approach that takes into account this dependence.
Summary
Overall, we want to use linear mixed models whenever our data have an inherent grouping, correlation, or hierarchical structure that violates the independence assumption of ordinary linear regression. In practical terms, this arises in many research scenarios. Two of the most common use cases are hierarchical (multilevel) data and longitudinal (repeated measures) data. As we have seen, in both these cases, observations can be naturally clustered: for hierarchical data, lower level units (e.g. students) are nested inside higher-level units (e.g. schools); for longitudinal data, multiple observations are nested within each subject over time. Mixed models are designed for exactly these situations because they account for the fact that observations within a cluster are more alike.
