Adjusting for differences at baseline in controlled trials

In randomised trials or repeated-measures experimental studies of randomised conditions, researchers often measure a continuous variable at baseline and at the end of the study at follow up. Examples of some outcomes include blood pressure, pain, physiological responses, range of motion, etc.
In a BMJ statistics note, methodologists Andrew Vickers and Doug Altman explain how these outcomes can be analysed. Researchers might only compare the between-group or between-condition outcomes at follow up, and conclude “at the end of the study, pain was 20% (95% CI 16-24%) lower in subjects who received the treatment compared to control.” Or, researchers might calculate the change in outcome from baseline to follow up and compare the change scores between groups or conditions to conclude “the reduction in pain was 25% (95% CI 20-30%) greater in subjects who received the treatment compared to control.” If average baseline scores are the same in each group, the estimated treatment effect will be the same using either approach.
If the treatment is effective, statistical significance of the treatment effect depends on the correlation between baseline and follow up scores. If the correlation between baseline and follow up scores is low, using change scores adds variability and consequently, the result is less likely to be significant. If the correlation between baseline and follow up scores is high, the result is more likely to be significant. However, it is not correct to choose an analysis method simply because it gives a significant finding.
Change scores are often used to account for differences between groups at baseline. However, they do not control for baseline imbalances between groups. This is because subjects with low scores at baseline tend to improve more than those with high scores, a phenomenon known as regression to the mean. A better approach to adjust for differences at baseline is to use an analysis of covariance (ANCOVA) which, in spite of its name, is a type of regression. In an analysis of covariance, follow up scores are plotted against baseline scores and parallel straight lines (linear regression) are fitted through the scores for treatment and control groups, such that:
follow up score = constant + (a x baseline score) + (b x group)
where a and b are regression coefficients and group is a binary dummy variable with control coded as 0 and treatment coded as 1. The main coefficient of interest is b, which is the estimated difference between the treatment and control group. An analysis of covariance adjusts each subject’s follow up score for their own baseline score, but is unaffected by baseline differences and regression to the mean.
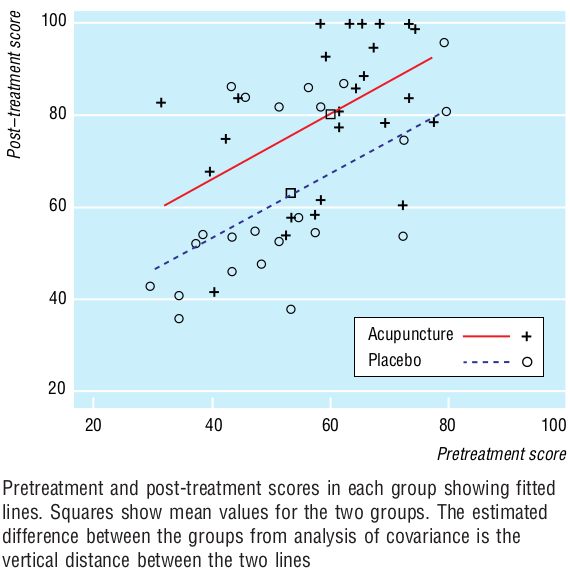
Vickers and Altman illustrate this method using pain scores before and after a randomised controlled trial comparing acupuncture to a placebo intervention. Data are reproduced in Figure 1 here:
Figure 1:
From the analysis of covariance:
follow up score = 24 + (0.71 x baseline score) + (12.7 x group)
The coefficient for group, 12.7, is the difference between the mean change scores of each group. We may conclude that “pain improved by 12.7 points more on average in the treatment group than in the control group.” Since analysis of covariance is a type of multiple regression, this analysis can be extended to include additional covariates or prognostic variables.
Summary
An analysis of covariance adjusts each subject’s score for their baseline score and is unaffected by chance baseline differences and regression to the mean. This method is easily applied to data at two time points, and assumes linearity between baseline and follow up scores where data are continuous.
In principle, it is possible that similar methods can be applied for repeated measures data over more than two time points, although it is less clear for data that are non-linear. If you know or use such methods, please feel free to share.
Reference
Vickers AJ and Altman DG (2001) Analysing controlled trials with baseline and follow up measurements. BMJ 323:1123–4.

For the model:
the coefficient b measures whether the treatment works overall. If we want to ask instead whether the treatment works differently depending on baseline score, include an interaction term between baseline score and group in the model:
Here, the coefficient c measures, for example, if the treatment works better in patients with higher baseline pain scores.
With thanks to Dr Andrew Vickers for clarification.
LikeLike