R: How to reshape data from wide to long format, and back again

Many studies take repeated observations on subjects. For example, clinical trials record outcomes from subjects before and after treatments, and laboratory studies might record physiological outcomes from the same subjects over time.
In a dataframe, when observations from each subject are written on one row and repeated observations are stored as different column variables, we say the data are in “wide” format. In contrast, when repeated observations from each subject are written on separate rows so that each subject has data over more than one row, we say the data are in “long” format.
Different programs and functions/modules of these programs require data to be in wide or long formats. Here, we will use R to reshape an example dataset from wide to long format, and from long back to wide format. This is a summary and extension of a UCLA resource here. The open access example dataset “hsb2.csv” may be found here or in my supplementary files.
Download the dataset, read in and assign it to the dataframe df, and print the first 10 rows:
# Comment out install.packages line if ggplot2 already installed
install.packages("ggplot2")
library(ggplot2)

df <- read.table("hsb2.csv", header=T, sep=",")
df[1:10,]
We see that the data are in wide format:
    id female race ses schtyp prog read write math science socst
1   70      0    4   1      1    1   57    52   41      47    57
2  121      1    4   2      1    3   68    59   53      63    61
3   86      0    4   3      1    1   44    33   54      58    31
4  141      0    4   3      1    3   63    44   47      53    56
5  172      0    4   2      1    2   47    52   57      53    61
6  113      0    4   2      1    2   44    52   51      63    61
7   50      0    3   2      1    1   50    59   42      53    61
8   11      0    1   2      1    2   34    46   45      39    36
9   84      0    4   2      1    1   63    57   54      58    51
10  48      0    3   2      1    2   57    55   52      50    51
We reshape the data to long format and use ggplot2 to plot read, write and math scores for each subject. The reshape command for wide to long requires this information:
- varying: list of variable names defining the times/conditions to reshape
- v.names: name of varible containing the times/conditions data values
- timevar: name of variable describing the times/conditions
- times: list of variables whose data values are given to
v.names - direction: the final format of the data
We reshape data on read, write and math scores from wide to long format, provide new row names, and print the first 10 rows:
# Reshape wide to long
l <- reshape(df,
  varying = c("read", "write", "math"),
  v.names = "score",
  timevar = "subj",
  times = c("read", "write", "math"),
  new.row.names = 1:1000,
  direction = "long")
# sort by id
l.sort <- l[order(l$id),]
l.sort[1:10,]
Now, the data are in long format. Eg. subject id 1 has read, write and math scores stored on three rows; we know the respective data values 34, 44 and 40 belong to subject 1 because they are linked to a unique subject identifier:
    id female race ses schtyp prog science socst  subj score
99   1      1    1   1      1    3      39    41  read    34
299  1      1    1   1      1    3      39    41 write    44
499  1      1    1   1      1    3      39    41  math    40
139  2      1    1   2      1    3      42    41  read    39
339  2      1    1   2      1    3      42    41 write    41
539  2      1    1   2      1    3      42    41  math    33
84   3      0    1   1      1    2      63    56  read    63
284  3      0    1   1      1    2      63    56 write    65
484  3      0    1   1      1    2      63    56  math    48
112  4      1    1   1      1    2      39    51  read    44
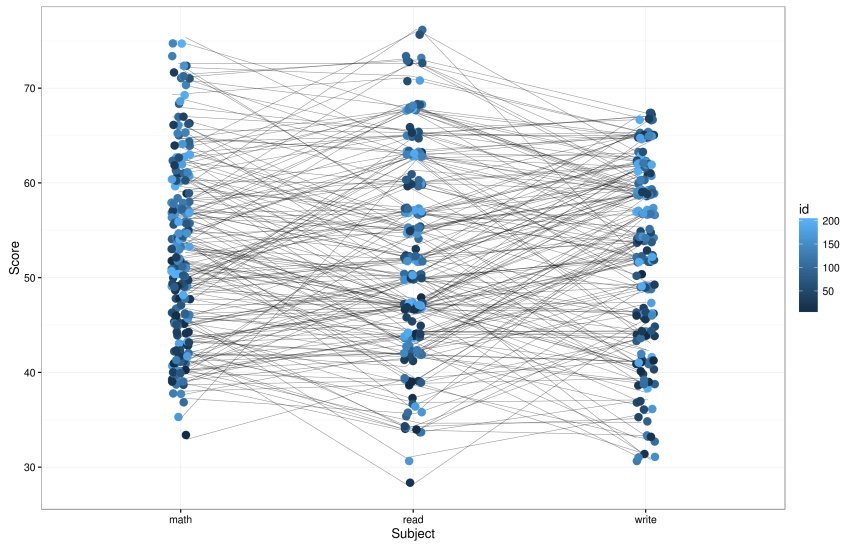
We plot read, write and math scores across subjects and generate Figure 1:
# plot figure
set.seed(1)
fig <- ggplot(l, aes(x=subj, y=score, group=id)) +
  geom_line(size=0.2, alpha=0.5, position=position_jitter(width=0.1)) +
  geom_point(aes(color=id), size=3, position=position_jitter(width=0.1)) +
  xlab('Subject') +
  ylab('Score') +
  theme_bw()
plot(fig)
# save figure
png(filename="figure.png", width=11, height=7, units='in', res=300)
plot(fig) [MH: You have this line twice in your code; any particular reason?]
dev.off()
Figure 1:
We can also reshape the dataframe from long back to wide format. The reshape command for long to wide requires this information:
- timevar: name of variable defining repeated measures for each subject
- idvar: list of variables that do not change within subject
- direction: the final format of the data
# Reshape long to wide
w <- reshape(l.sort,
  timevar = "subj",
  idvar = c("id", "female", "race", "ses", "schtyp", "prog", "science", "socst"),
  direction = "wide")
w[1:10,]
The data are now in wide format. Notice that variables of read, write and math scores are now prefixed as score.read, score.write and score.math:
    id female race ses schtyp prog science socst score.read score.write score.math
99   1      1    1   1      1    3      39    41         34          44         40
139  2      1    1   2      1    3      42    41         39          41         33
84   3      0    1   1      1    2      63    56         63          65         48
112  4      1    1   1      1    2      39    51         44          50         41
76   5      0    1   1      1    2      45    31         47          40         43
149  6      1    1   1      1    2      40    41         47          41         46
50   7      0    1   2      1    2      47    51         57          54         59
94   8      1    1   1      1    2      44    48         39          44         52
60   9      0    1   2      1    3      44    51         48          49         52
154 10      1    1   2      1    1      53    61         47          54         49
Summary
The reshape command can be used to reshape a dataframe from wide to long format, and vice versa. We specify which variables to reshape and not others. R’s ggplot2 plotting function requires repeated measures data in long format for plotting.
