False-positive findings and how to minimize them

As scientists we collect data and look for patterns or differences. Because populations display variation and we are unable to collect data from all members of a population, statistical results will always possess a level of uncertainty.
For example, it is common to set alpha to 0.05. This implies that if there is no difference or effect, there is a 5% chance that our statistical analysis will return a significant result (p < 0.05). This would be a false-positive result.
In his recent paper Minimizing the changes of false positives and false negatives, Curran-Everett demonstrates that the chance of obtaining a false-positive finding depends only of the value of alpha.
To fully understand how this might be I decided to run some simulations, which I now share with you.
Sampling data from two independent groups
A common approach is to collect data from two groups and use a statistic to determine whether these groups differ. Put differently, we want to determine whether these two groups (i.e., samples) come from the same or different population.
In this situation, the null hypothesis (Ho) might be that the two groups come from the same population, and therefore have the same mean. This hypothesis can be tested with an independent t-test.
Let’s use the example where the population data are normally distributed with a mean of 0 and a standard deviation is 0.1.

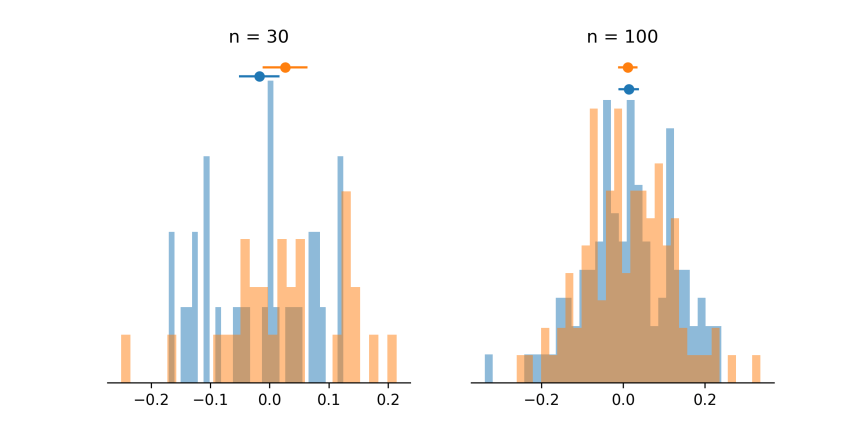
Let’s conduct a first experiment were we randomly select 30 subjects from this population and assign them to group 1 and then sample another 30 subjects and assign them to group 2. Now let’s repeat this process, but this time select 100 subjects for each group. Remember, we are always sampling from the same population, so we know that the null hypothesis (Ho) is true. But because the population has variability and our groups only include a small proportion of all individuals in the population, we may, by chance, conclude that the null hypothesis is not true (i.e., a false positive).
The figure below shows the distribution of these two simulated studies. On the left we can see that with a smaller sample of subjects, the underlying population distribution (i.e., normal distribution) is not obvious. We can also see that, despite being sampled from the same population, the means of the two groups differ somewhat.
The underlying distribution is somewhat clearer in the panel on the right where each group contains 100 subjects. Also, the means of the two groups are more similar compared to when the groups contained 30 subjects. We can also see that the 95% confidence intervals are much narrower. This indicates that with larger samples we have a greater amount of precision in our estimate of these means.
Testing for differences and false-positive rates
In the example provided above, the 95% confidence intervals of the two groups overlap. This indicates that the group means are likely not different from one another.
However, if we set alpha to 0.05, we expect 5% of these simulation studies to return a false-positive. That is, the 95% confidence intervals would not overlap and (erroneously) indicate that the groups means are different from one another. Is this in fact the case? Does this apply to group sizes of 30 and 100?
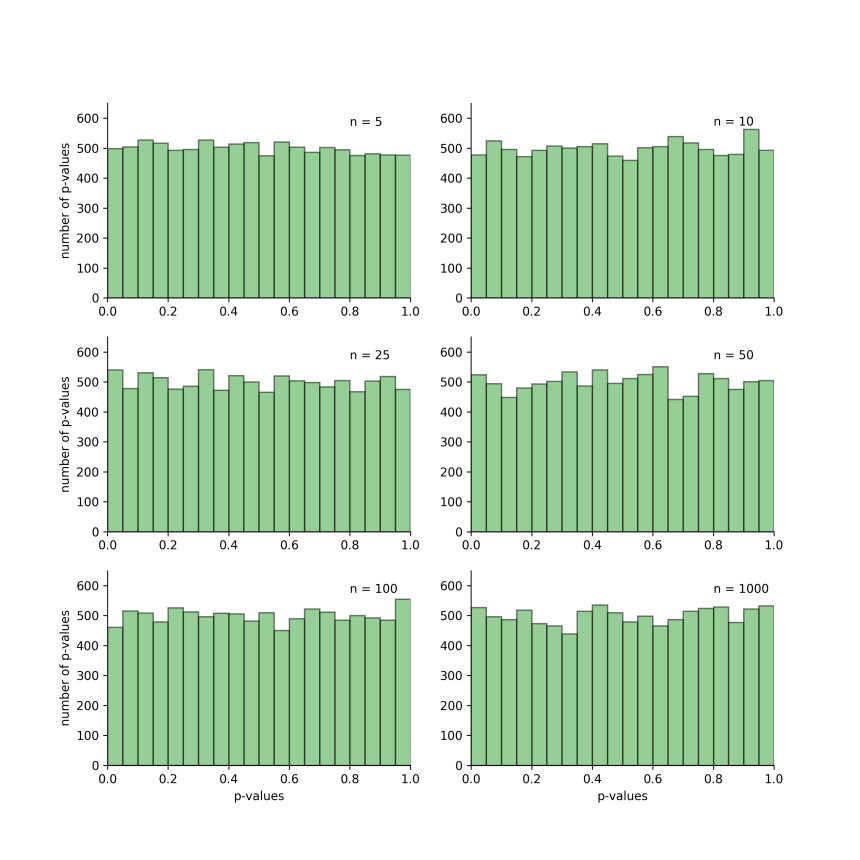
Let’s run more simulated studies to see if this holds up. For the simulations, we sampled n subjects per group and performed an independent t-test between these groups. This process was repeated 10000 times and the resulting p-values were plotted. To determine whether sample size influences the rate of false-positive findings, n was set to either 5, 10, 25, 50, 100 and 1000.
Each plot below is a histogram of the p-values obtained for the 10000 simulations. If we consider the top-left figure, we can see that when each group had a sample size of 5, there were approximately 500 p-values in the first bin of the histogram, which corresponds to p-values between 0.0 and 0.05. All other bins contain approximately the same number of p-values. This indicates that if we conducted 10000 experiments and set alpha to 0.05, we would obtain approximately 5% false-positives.
The picture is the same for all sample sizes. Thus, the rate of false-positives doesn’t depend on sample size.
Effect of population variance on false-positive rates
Now we will determine whether the amount of variability in the population influences false-positive rates.
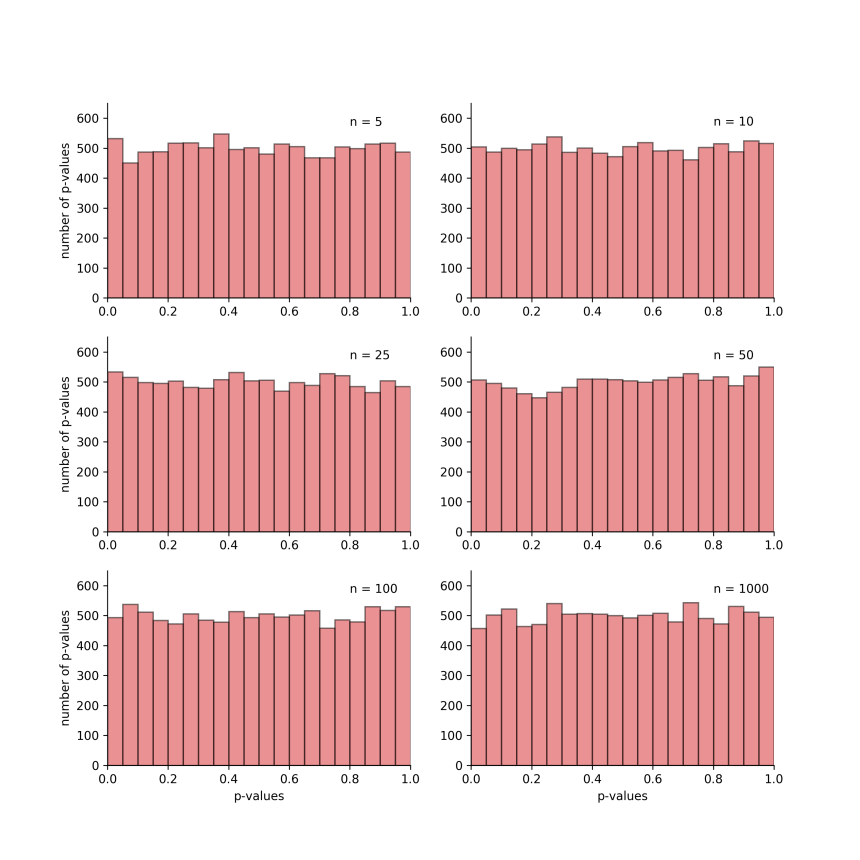
For this next set of simulations, let’s create a new population with much more variability. This time, its mean will be 0 and its standard deviation will be 0.5. The figure below shows our previous population in brown and our newly created, more variable population in pink.

Let’s repeat our previous series of simulation and see what happens to the false positive rates. As we can see below, the results are pretty much the same, confirming that the amount of variability in the population we are studying does not influence the false-positive rate.
Summary
As pointed out by Curran-Everett, our chosen level of alpha is the most important factor when it comes to false-discovery rates. So if we want to reduce the chances of obtaining a false-positive results, we should follow the recommendation by Curran-Everett and set our alpha levels to 0.005 or 0.001.
Reference
Curran-Everett D (2017). Minimizing the chances of false-positives and false negatives. J Neurophysiol 122, 91-95.

Dear Lee, thanks for the comment.
First, I don’t see much use in doing statistics in very small samples (e.g. 2, 3, 4). The best things there is simply to plot the individual data points and let the reader decide whether any apparent difference is, to them, based on their knowledge of the field, meaningful.
Second, I did not use Welch’s t-test. I suspect that it would not change the results or conclusions, but it is definitely worth another look.
Finally, the approach I used was to prove the point that sample size (or variance in the data) does not impact the rate of false-positive findings. I would have to think about how to tackle this for looking at false-negatives. Do you have any suggestions?
I am a bit swamped at the moment, but will definitely return to your questions in the new year.
If you are curious about adding those very small sample sizes or running the Welch t-test, the code I used to write the blog post is available here: https://github.com/MartinHeroux/ScientificallySound_files/blob/master/power_effect_size.py
To run a Welch t-test, we can use scipy.stats.ttest_ind and set
equal_valtoFalse. More info can be found here:https://docs.scipy.org/doc/scipy/reference/generated/scipy.stats.ttest_ind.html
LikeLike
I would like to see this repeated this for n = 2, n = 3, and n = 4. Also, did you use Welch’s t-test? Also, how might you approach analyzing the effect of sample size on false negatives?
LikeLike