Verify if data are normally distributed in R: part 1

Many statistical tests assume that the sampling distribution is normally distributed. This does not mean that the data we collected for our experiment is normally distributed, but rather that the distribution of mean values from many samples of the same size will be normally distributed. Unfortunately, we do no have access to the sampling distribution. However, based on the central limit theorem, we know that if our sample is approximately normally distributed, so too will be the sampling distribution.
There are a few ways to assess whether our data are normally distributed, the first of which is to visualize it.
Three different samples
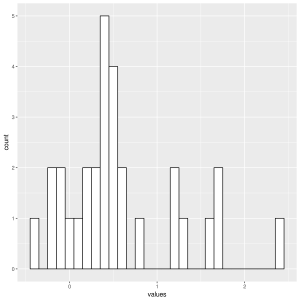
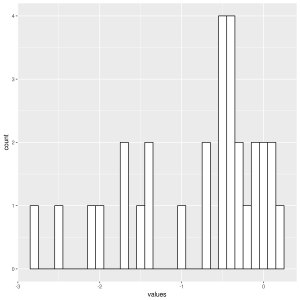
To verify whether our data (and the underlying sampling distribution) are normally distributed, we will create three simulated data sets, which can be downloaded here (r1.txt, r2.txt, r3.txt). Each sample contains 30 observations from a different population. The samples are plotted below.

Frequency distributions and density plots
The first graphs that we will learn to make in R are frequency distributions and density plots. These graphs are useful because they allow us to see the general shape of the distribution.
# Import ggplot2
library(ggplot2)
# Set the working directory to location of data (change as needed)
setwd('~/Desktop')
# Read the data
r1 = read.csv('r1.txt', header=FALSE)
r2 = read.csv('r2.txt', header=FALSE)
r3 = read.csv('r3.txt', header=FALSE)
# Rename the columns
names(r1) <- 'values'
names(r2) <- 'values'
names(r3) <- 'values'
# Generate and same histogram
p1 = ggplot(r1, aes(x=values)) +
  geom_histogram(binwidth=.25, colour="black", fill="white")
p1
ggsave('r1.png')
# Repeat for r2 and r3
Histogram of r1

Histogram of r2

Histogram of r3

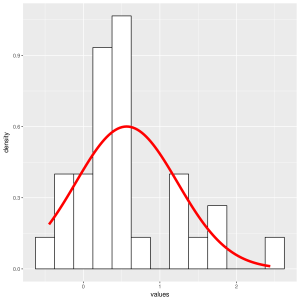
In order to better visualise the distribution of our data, we will add density plots over our histograms. When plotted together like this, it is easy to get a general idea of whether our data are normally distributed or not.
# Continuing from previous session...

# overlay histogram and density plot
p11 = ggplot(r1, aes(x=values)) +
            geom_histogram(aes(y = ..density..), binwidth=.25, colour="black", fill="white") +
            stat_function(fun = dnorm, lwd = 2, col = 'red',
                          args = list(mean = mean(r1$values), sd = sd(r1$values)))
p11
ggsave('r11.png')
# Repeat for r2 and r3
Histogram and density plot of r1

Histogram and density plot of r2

Histogram and density plot of r3

Q-Q graphs
The other type of graph that is useful when investigating whether our data are normally distributed is the q-q graph. The quantile-quantile graph plots the cumulative values we have in our data against the cumulative probability of a particular distribution. In our case, we will be using the normal distribution.
stat_qq_line().
ggplot2 has recently added functionality to its qq geometry. It is now possible to add the diagonal line to Q-Q graphs. However, this functionality was not available in the currently available version of ggplot2.
You should be able to use some of these new features soon.
The values in our data are ranked and sorted, and each value is then compared to the expected value that the score should have in a normal distribution. If our data are normally distributed, the values in our data should have approximately the same values as those from a normal distribution, which would result in a straight diagonal line.
We can generate a simply Q-Q plot with the following code:
p111_1 <- ggplot(r1, aes(sample = values)) + stat_qq()
P111_1
ggsave('r111_1.png')
Q-Q graph of r1

As you can see from the resulting figure, it can be a little difficult to view the expected diagonal line. Therefore, we can use the following R function to add the diagonal line on our Q-Q plot.
qqplot.data <- function (vec) # argument: vector of numbers
{
  y <- quantile(vec[!is.na(vec)], c(0.25, 0.75))
  x <- qnorm(c(0.25, 0.75))
  slope <- diff(y)/diff(x)
  int <- y[1L] - slope * x[1L]
  d <- data.frame(resids = vec)
  ggplot(d, aes(sample = resids)) + stat_qq() + geom_abline(slope = slope, intercept = int)

}
By running this code, we now have access to our new function, qqplot.data. This makes it easy to generate Q-Q plots with the corresponding diagonal line.
p111 <- qqplot.data(r1$values)
p111
ggsave('r111.png')
# Repeat for r2 and r3
Q-Q graph with diagonal for r1

Q-Q graph with diagonal for r2

Q-Q graph with diagonal for r3

As we can see, data from r1 stay close to the ideal diagonal line, indicating they are most likely normally distributed. The story is not as clear for r2 and r3. Data from these two samples do not stay as close to the ideal diagonal line, providing some evidence that our data might be skewed.
Summary
In this post we have learned how to visually inspect our data to see if they are normally distributed. We generate histograms with density plots, as well as Q-Q plots and their corresponding diagonal lines. While this provides a good indication of whether or not our three data sets are normally distributed or not, visual inspection can lead to varied interpretations. In our next post, we will learn how to characterise, numerically, the distribution of our data.

Hi Andrzej, I am more familiar with Python programming and plotting, but I am certain you can achieve your desired plot with ggplot.
You will want to look at the newish quantile-quantile plot that was added to ggplot. I have a link to it in the post. In fact, one of the examples on that linked page includes three quantile-quantile plots overlaid on the same figure, very close to what you want to achieve. To change the colour of the line will simply be specify one of the arguments to the ‘stat_qq_line()’ part of the ggplot command.
Hope that helps.
LikeLike
Hi, is it possible to overlay all three qqplots and/or place them side-by side for better comparison ? Is it possible to do it all with ggplot2 with diagonal line in red colour ?
LikeLike