Confused interactions

I am used to confused interactions, likely because I get along better with dogs and kids than I do with adults. But that is not what Nieuwenhuis et al. had in mind when they surveyed 513 articles relating to behavior, cognitive function or brain imaging from leading journals (Nature, Science, Nature Neuroscience, Neuron, Journal of Neurosience). What they were looking for were errors in how interactions in statistical analyses were analysed and interpreted.
What is an interaction?
You can skip this section if you are familiar with main effects and interactions from ANOVA-type statistics.
The simplest analysis possible that can have an interaction is a 2-factor analysis of variance, with two levels for each of these factors. For example, I might have carried out a study on the effect of reading scientificallysound.org blog posts on scientific IQ scores. Importantly, the two factors investigated were the author of the blog posts (Joanna, Martin) and the gender of the study participants (female, male).
When performing a 2-factor analysis of variance, most statistical packages will return the statistic associated for each of the factors (main effects) and the interaction between these factors. Below is an illustration of some of the possible outcomes from our fictive study:

The top row of figures present results with no interaction between the factors author and gender. These results are fairly straight forward to understand.
The bottom row of figures present results with a mixture of main effects and an interaction between author and gender. Results with interactions can be complicated to interpret, especially when you have more than two factors (just image if we added the effect of viewing device (computer, phone); we could end up with a three-way interaction between author, gender and viewing device…scary stuff!).
Looking at Figure E, we can see that the average score of women (pooling across those that read my blog posts or Jo’s blog posts) will be larger than the average score of men (again pooling across author). This explains the main effect of gender. However, the average score across subjects that read my blog posts (pooling across men and women) will be similar to the average score of subjects that read Jo’s blog posts (pooling across gender). Finally, it appears that the men that read my blog posts seemed to have a greater decline in scientific IQ scores compared to the women who read my blog posts (i.e. the slope of the line connecting the two white dots is steeper for the men). This explains the author by gender interaction.
A similar logic can be used to understand the main effects and interactions of Figures F-H.
What error did Nieuwenhuis et al. look for?
Nieuwenhuis et al. scanned papers for the following fallacy: the difference between significant and non-significant need not itself be statistically significant.
Say that five times fast!
But what does this mean? Here is a fictive example presented by Nieuwenhuis et al.:
“The percentage of neurons showing cue-related activity increased with training in the mutant mice (P<0.05).”
Presumably, the authors of this fictive study wanted to claim that the change in cue-related activity with training was greater in the mutant mice compared to the control mice. However, to make this claim, the authors need to report a statistically significant interaction.
The fact that there was a statistically significant increase in one group, but no statistically significant change in the other group does not inform us whether the difference between these two effects is in fact statistically significant. That is: the difference between significant and non-significant need not itself be statistically significant.
What did Nieuwenhuis et al. find?
Despite reviewing articles from the best of the best journals, Nieuwenhuis et al. found that 50% (!) of papers used the incorrect procedures to analyse and report the combined effect of two experimental conditions.
The breakdown of their findings is presented below:
| Nature | Science | Nature Neuroscience | Neuron | Journal of Neuroscience | Summed | |
|---|---|---|---|---|---|---|
| Total reviewed | 34 | 45 | 117 | 106 | 211 | 513 |
| Correct count | 3 | 9 | 17 | 13 | 36 | 78 |
| Error count | 7 | 11 | 16 | 15 | 30 | 79 |
In their article, Nieuwenhuis et al. include a figure that illustrates the three main types of errors they came across. The figure is reproduced below:
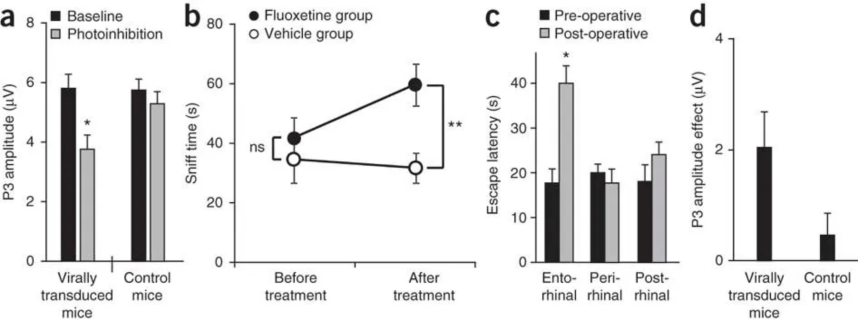
Graphs illustrating the various types of situations in which the error of comparing significance levels occurs. (a) Comparing effect sizes in an experimental group/condition and a control group/condition. (b) Comparing effect sizes during a pre-test and a post-test. (c) Comparing several brain areas and claiming that a particular effect (property) is specific for one of these brain areas. (d) Data presented in (a), after taking the difference of the two repeated-measures (photoinhibition and baseline). Error bars indicate s.e.m.; ns, nonsignificant (P > 0.05), *P < 0.05, **P < 0.01.
Summary
Was I surprise by the results of this audit performed by Nieuwenhuis et al.? Yes and no.
Yes, because they survey articles in top journals. Naively, I thought top journals would have had the best reviewers, including statistical reviewers, that would have identified these types of errors.
No, because I have seen this type of error numerous times, both in published papers and papers I have been asked to review.
It has been 8 years since Nieuwenhuis et al. published their paper, and it would be interesting to see whether their paper had any impact on the field. While there may be some improvement in the journals that were targeted in their survey of articles, this statistical fallacy has definitely not been eradicated. Thus, stay sharp and keep an eye out for it!
References
Nieuwenhuis S, Forstmann BU & Wagenmakers EJ (2011). Erroneous analyses of interactions in neuroscience: a problem of significance. Nature Neuroscience 14:1105–1107.
