spike2py: a python package to process data collected with spike2

With the help of Bob and Julian from Pybites, I was recently able to publish my first Python package on PyPi. For those who don’t know, PyPi is the official Python repository for open source packages; it is where you can upload your code to share with the rest of the Python community.
A few years ago I was doing lots of data and signal processing for experiments that used Spike2 software and Cambridge Electronic Design (CED) 1401 data acquisition hardware to collect data. Unfortunately Spike2 is a proprietary piece of software with a unique coding language. In fact, most users never code using Spike2. Rather, they point-and-click using the graphical user interface to collect as well as process their data. Many years ago, I used to export Spike2 data to Matlab, where I could do all my data and signal processing. But given that I was using Python for all my coding, I decided to create a Python package that I could use.
As happens all too often, I coded my Python package relatively quickly because I needed to get the job done. I was not thinking of usability or maintainability. I simply needed something that would help me analyse the data I had. But now, a few years later, I started using that package again and realised it had some major limitations. So, with the help of the folks at Pybites, I decided to take my coding to the next level and completely rewrite my Python package to process data collected with Spike2. The end product was spike2py, my first ever public Python package.
What spike2py is (and what it isn’t)
spike2py provides a simple interface to analyse and visualise data collected using Spike2 software and CED data acquisition boards. With it you can easily plot data from individual channels or all channels from a given trial. In addition, you can easily apply various signal processing methods to your waveform data. Finally, you can easily save your data at any point, allowing you to re-open and continue your work from where you left off.
spike2py is (somewhat) based on the Unix philosophy: do one thing and do it well. I say ‘somewhat’ because spike2py actually does a few things. I also say ‘somewhat’ because the jury is still out on whether spike2py actually does things well!
spike2py aims to simplify a few of the basic speed bumps to analysing Spike2 data in Python.
- It imports and parses the data
- It plots trial and channel data
- It stores data for later use
- It can execute many common signal processing steps
The rest is left up to you, the user.
You will have to code the analysis pipeline to extract the outcomes you are interested in across the all the trials collected from all your participants. You will have to code your own figures to highlight certain aspects of your data. You will have to code your own statistical analyses.
A simple example
To demonstrate, the following snippet of code shows you how to:
- Read a file
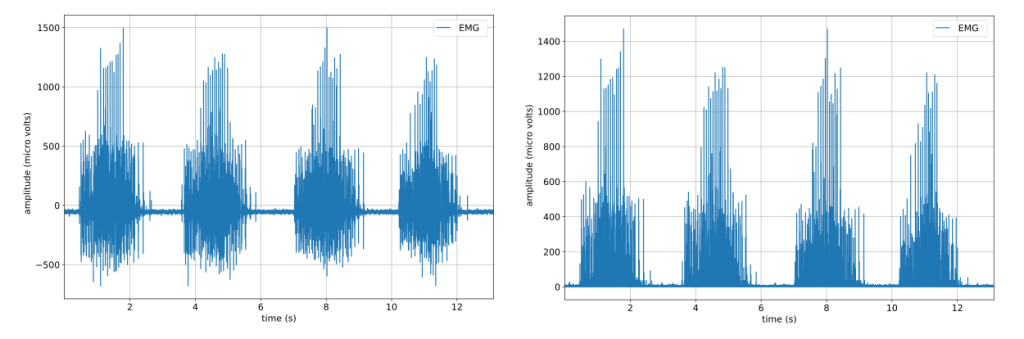
- Plot the electromyography (EMG) signal from one of the channels
- Remove the mean of the first 500 samples and rectify EMG signal, and plot the result
>>> from spike2py.trial import TrialInfo, Trial
>>> trial_info = TrialInfo(file="sample.mat")
>>> sample = Trial(trial_info)
>>> sample.muscle_emg.plot()
>>> sample.muscle_emg.remove_mean(first_n_samples=500).rect().plot()
As you can see, spike2py requires Spike2 data to be exported to .mat format. The simplest way to accomplish this, especially if you have multiple files to export, is to use a Spike2 script to do this automatically. The spike2py documentation provides instructions on how to do this.
Method chaining
As the above example demonstrates, spike2py uses method chaining. This is a powerful tool that helps write very readable and compact code. For example:
>>> sample.muscle_emg.remove_mean(first_n_samples=500).rect().plot()
Our object called sample contains information about a Spike2 channel called muscle_emg. The above code first removes the mean of the first 500 samples from the EMG signal. It then rectifies the mean-removed signal. And finally, it plots the processed data.
Plotting
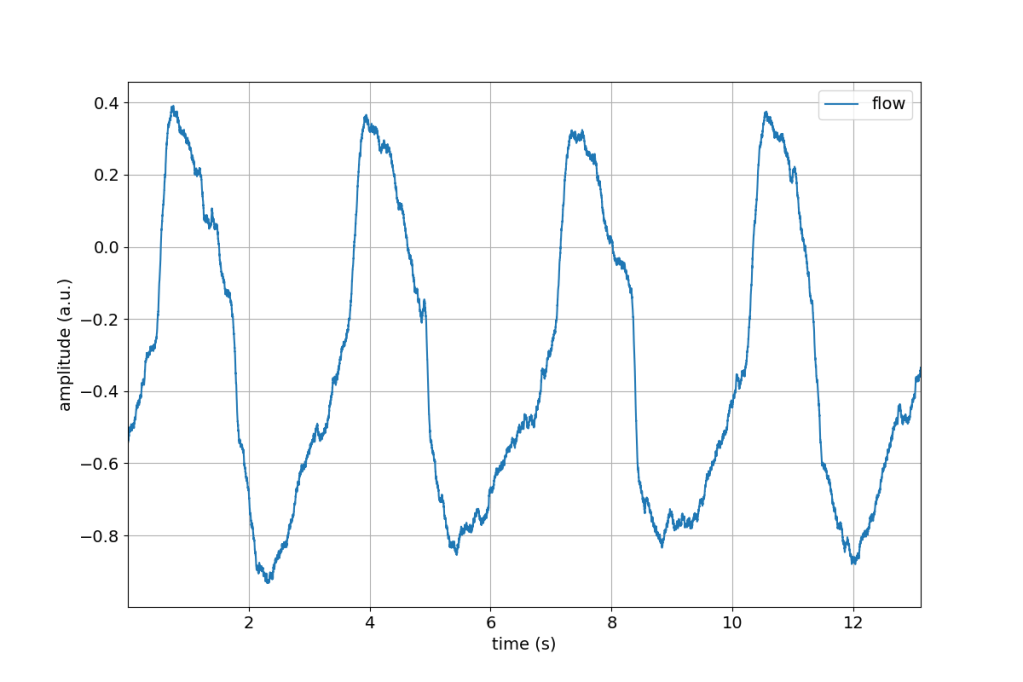
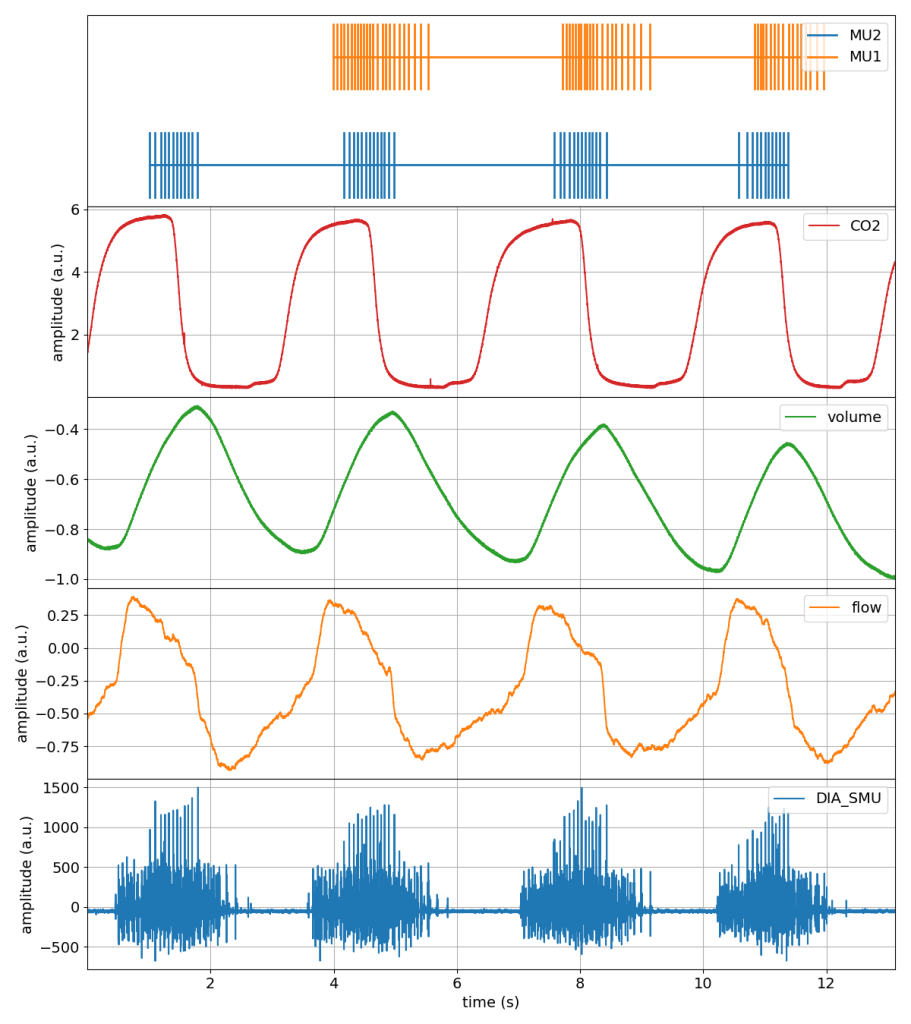
Two of the most common tasks when first analysing signals are to plot them and to process them. To help beginners get started, spike2py ships with a plot() method that can be used to generate a plot of any signal, or of every signal from a given trial. Examples of such figures are included below.
spike2py also comes with a basic set of signal processing methods. As mentioned above, these can be used in a chained approach.
Getting started
If you are interested in reading more about spike2py, you can head over to the project’sGithub page. You can also head over to the official spike2py documentation page. There you will find instructions on how to install spike2py, test the installation, and run through a simple tutorial to get you started. Best of all, you don’t need a dataset to get started: spike2py comes with a tutorial dataset.
Conclusion
Although it was challenging, turning spike2py into an open source Python package taught me a great deal about programming, software development, computer science, and open source software. As expected, the package likely still has a few bugs that will become apparent as more people start using it. Also, some people may feel it is missing a key piece of functionality. Thankfully, that is what open source is about. People are encouraged to contact me or submit a Github issue or pull request to help improve spike2py.
