Statistics note: Why statistics is needed

Scientists ask questions about the world, design experiments, and use experimental findings to work out answers. In an experiment, descriptive statistics are used to summarise and describe observations from a sample (e.g., honey bees in Paris, voters from 5 electorates). However scientists are more interested in the population from which the sample was drawn (e.g., all honey bees in Europe, voters in all Australian electorates). This is because a description of the population provides information about every individual or object in the population, not only those that were sampled. This is where inferential statistics come in: they allow scientists to make inferences about the population based on data from the sample. The key idea is that inferential statistics uses information from individuals observed in the sample, to provide information about individuals that were not observed in the population.
The benefit of using statistics to describe sample observations and make inferences about populations becomes clear when it is compared to how data were presented in the past. For example, in 1968 the physiologist DK Hill wanted to know how muscle tension changes with respect to muscle length in frogs and toads. He collected muscle length and tension data from 8 frogs and toads and listed the data like so:
Figure 1: Table 4, Hill DK (1968) JPhysiol 199:637-684.
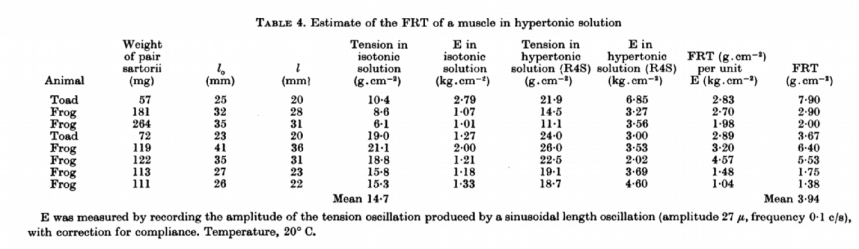
Hill used descriptive statistics to summarise data for some variables (e.g., muscle tension, column 5) but not others (e.g., muscle length, column 4). From the row of values for each animal in the table, Hill knew how each animal’s muscle length and tension changed under different experimental conditions. By calculating a mean value for muscle tension, he could summarise how tension changed on average across all the animals in his study. But without calculating a mean for muscle length, he could not summarise how length changed in the same way. Being able to summarise observations from individuals is important because it simplifies the task of understanding the data.
The main limitation of only knowing mean muscle tension for animals in this particular sample is that Hill would not know whether muscle tension changed in the same way in other animals. If Hill collected data from a second sample of 8 frogs and toads, he would likely obtain a different mean muscle tension. In theory, Hill could repeat his experiment many times and calculate a mean muscle tension for each sample. These mean muscle tension values would vary slightly because they were calculated from different samples of frogs and toads. Together, these mean values and their variation provide a good description of muscle tension in the population. That is, how the means vary across repeated samples would allow Hill to infer how muscle tension changes in all frogs and toads.
Summary
Statistics falls broadly into two categories: descriptive and inferential statistics. Descriptive statistics are used to describe individuals in a sample. Inferential statistics are used to describe all individuals in a population, using data obtained from a sample of these individuals. We are interested in the population because describing it provides information about each individual.
In the next post, we will learn what statistical inference is about.
