Statistics note: What are confidence intervals?

In the previous post we learned that the standard error of a sample statistic indicates how precisely a population parameter is estimated, and the standard error depends on sample size. For a given standard deviation, a small standard error is obtained when sample size is large. The standard error indicates how variable the sample statistic is if the experiment is repeated many times over. How can the standard error be used to indicate what values the sample statistic itself will take, with repeated experiments?
In statistical inference, the standard error is used to calculate the range of values a statistic is expected to take with repeated experiments. This range of values is known as a confidence interval. Narrow confidence intervals indicate a sample statistic estimates a population parameter with high precision.
In modern statistics, sampling distributions and standard errors can be obtained for just about any statistic. But experiments are usually performed to test hypotheses by comparing outcomes in groups of samples with different characteristics, or by manipulating one variable while controlling for as many other variables as possible. So the statistic that scientists are most interested in is the statistic that indicates the difference between groups of samples or between different testing conditions. In data analysis, the aim is to quantify the between-group or between-condition difference, and indicate how precisely that statistic estimates the population parameter.
To illustrate these ideas, let us consider an experiment where continuous data (e.g., height or muscle length) from two groups were collected. We would like to know how the groups differ in these data, so the between-groups mean difference and confidence intervals about the mean difference need to be calculated. The 95% confidence interval level (i.e., 95% CI) is the most widely used level, and is calculated for a mean difference in this way:

From the formula, the mean difference between groups is simply the difference of the group means. The mean difference of the samples gives the best estimate of the mean difference of the population. The 95% confidence interval is the range of values the mean difference will take with repeated experiments, and is calculated based on the mean difference and the standard error of the mean difference. The lower limit of the confidence interval is the mean difference minus roughly 2 standard errors, and the upper limit is the mean difference plus roughly 2 standard errors. In this example, the 95% confidence interval is interpreted as “we are confident that the true population mean difference lies between the lower limit and the upper limit 95% of the time (with repeated experiments)”.
The width of the 95% confidence interval indicates the precision about the estimate of the population mean difference because the standard error is included in this calculation. Consequently, the precision of the confidence interval is also influenced by sample size. Figure 1 shows the distribution of simulated data points sampled from 2 groups (top panel) and associated sampling distribution of the mean difference (bottom panel) as sample size increases (columns 1 to 3). Data for group 1 has a mean of 0, data for group 2 has a mean of 2, and data for both groups have standard deviation of 1. The horizontal black lines in plots along the bottom panel indicate the 95% confidence interval of the mean difference for experiments of that sample size, and all plots share the same x-axis scale.
Figure 1: Distribution of data points from two groups (a, b, c) and associated sampling distribution of the mean difference and 95% CI (d, e, f) for samples of group size 10 (a, d), group size 30 (b, e) and group size 100 (c, f). 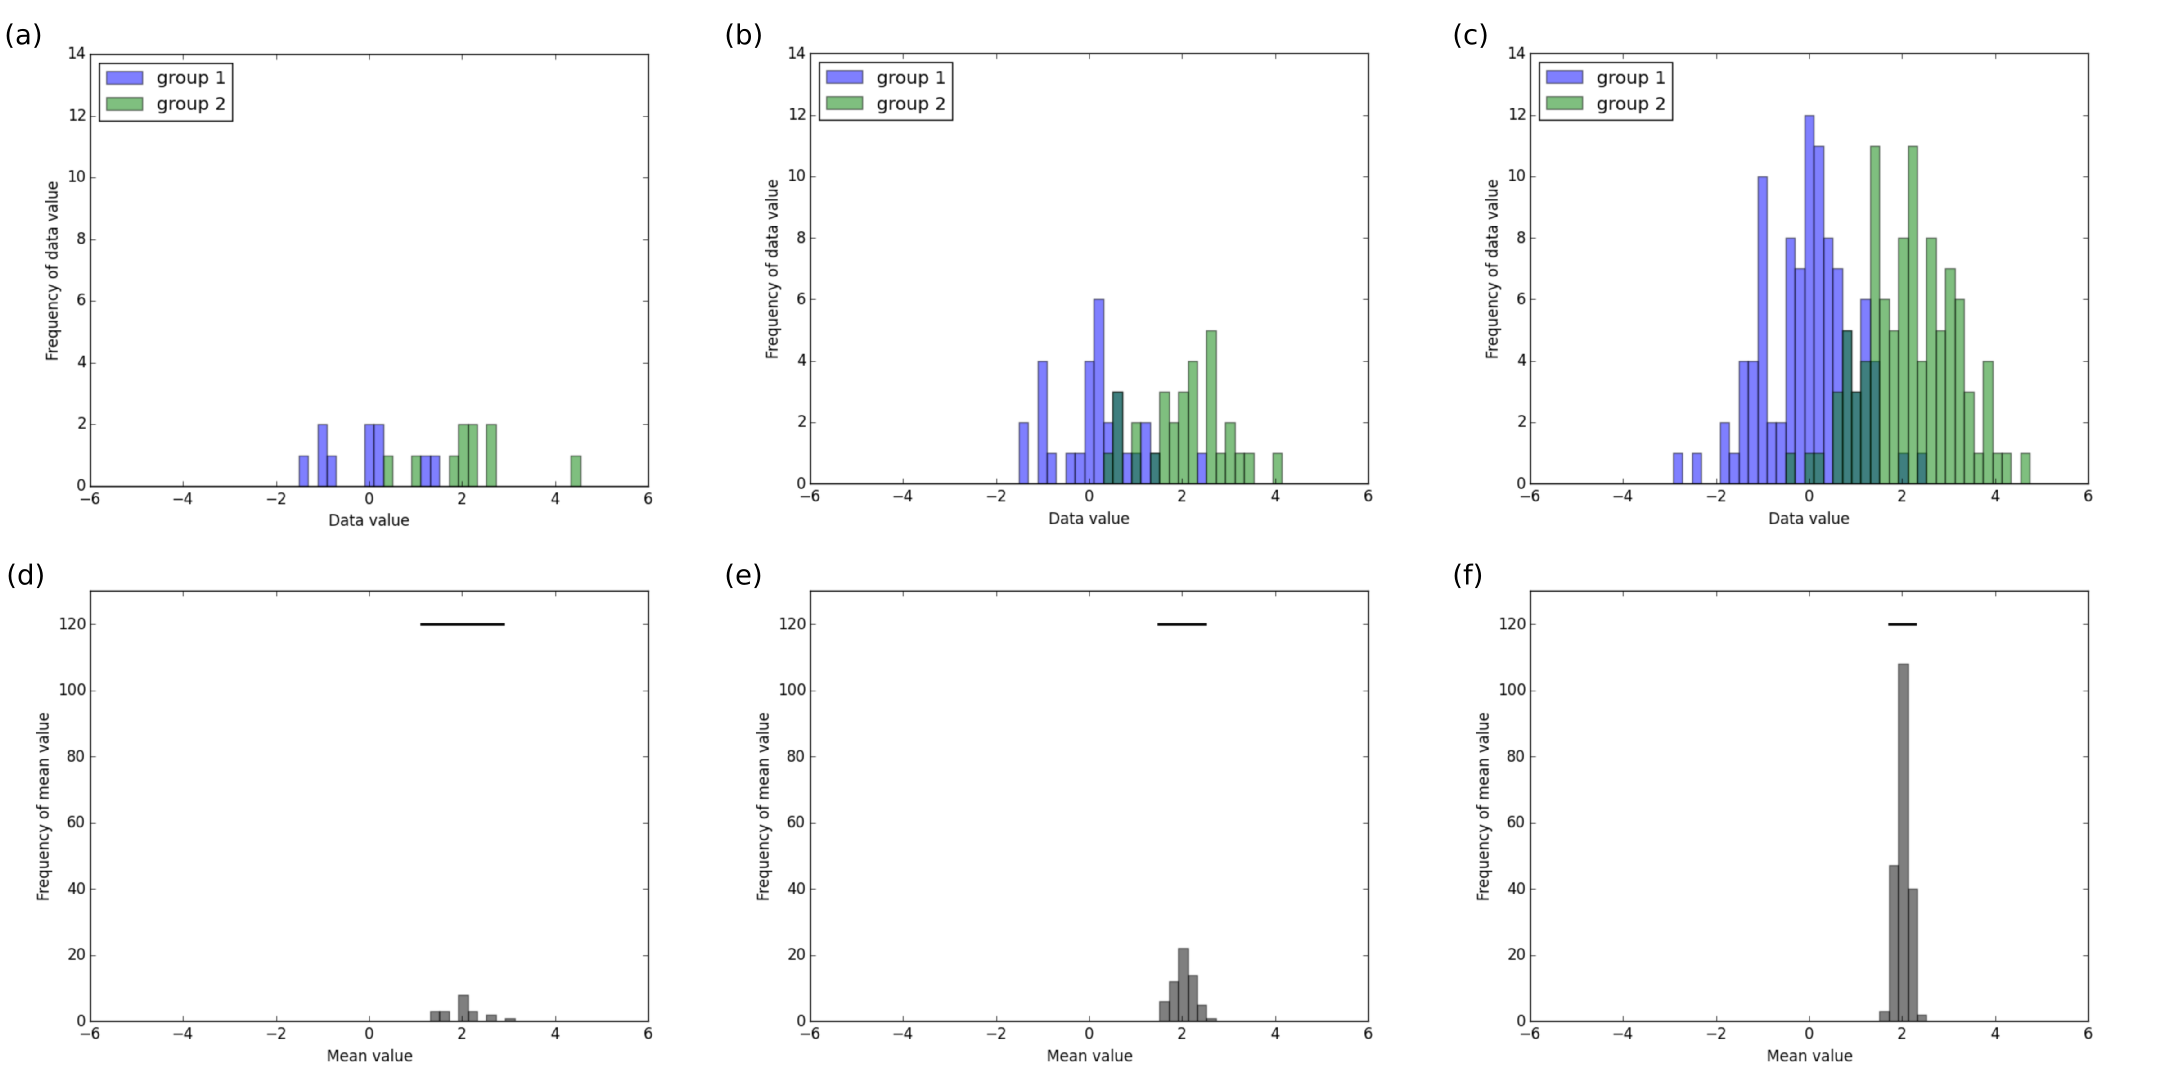
From the figure, it is clear that the width of the confidence interval decreases as sample size increases. That is, larger samples provide more precise estimates of the mean difference. The 95% confidence intervals of the mean difference in the different experiments are 1.12 to 2.88 (width 1.75) for group size 10, 1.49 to 2.51 (width 1.01) for group size 30, and 1.72 to 2.28 (width 0.55) for group size 100. The interpretation of the results for the experiment with group size 100 for example, is “the values in group 2 are a mean of 2 units higher than the values in group 1, and we are confident that the true mean difference lies between 1.72 to 2.28 units 95% of the time (with repeated experiments)”.
The key idea is that confidence intervals indicate the range of values a statistic is expected to take with repeated experiments, not the range of values of data points. In general, because the standard error is proportional to the square root of sample size, sample size has to quadruple in order to halve the width of the confidence interval. Precise estimates of effects, indicated by confidence intervals about the estimates, are obtained when sample size is large. Scientists need to test more samples in their experiments to make inferences about the population with more certainty.
Summary
Estimates of effects provide information about the magnitude of effect and precision of the estimate. 95% confidence intervals (95% CI) indicate precision about estimates of population parameters and are influenced by sample size. Large sample size is needed to provide narrow confidence intervals and consequently, provide precise estimates of effects.
