How are confidence intervals useful in understanding replication?

The growing awareness of the need for reproducibility in research is encouraging, but what does reproducible research actually look like in practice?
Marty and I recently had an interesting discussion on what it means for a study’s findings to be independently replicated, and the metrics scientists use to interpret reproducibility. I tend to interpret level of reproducibility using confidence intervals because after a study is done, the 95% confidence interval (CI) indicates how precisely a sample statistic estimates the population parameter. For example, if a study tries to estimate a population mean using the mean from a sample, the 95% CI indicates that 95% of all unobserved CIs will capture the population mean. Loosely speaking, we can be 95% certain that the population mean is captured in a single CI. A narrow 95% CI indicates that the population parameter was estimated more precisely. Consequently, I would think that independent replication studies are more likely to succeed if the original study’s 95% CI was narrow.
On the other hand, many scientists likely interpret level of reproducibility using tests of significance (ie. p values). For example, if a study found a statistically significant effect of a test condition on an outcome, scientists might think a large proportion of independent replication studies would find statistically significant effects as well.
The statistician Geoff Cumming and mathematician Robert Maillardet used simulations to show how replication findings may be interpreted using confidence intervals or p values. The key points from their paper are:
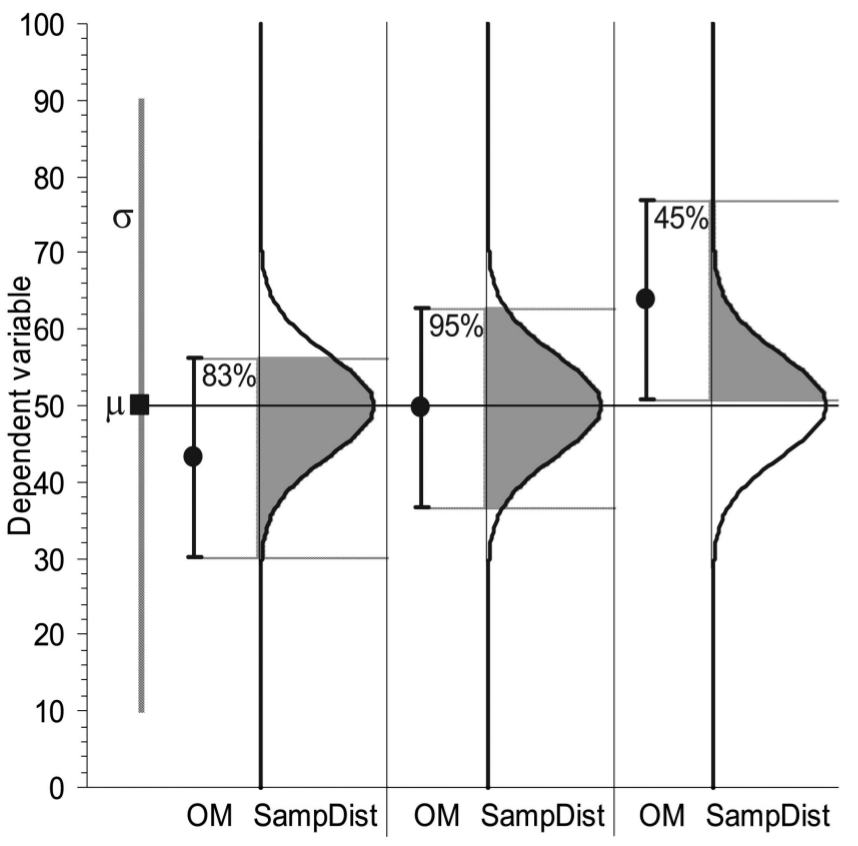
- The extent to which the CI of an original study captures the sample mean of a replication study is influenced by two sources of variability: the variation of the original mean about the population mean, and the variation of the replication mean about the population mean. If a study reports 95% CI, on average, only 83% of replication means would fall within the original 95% CI (Figure 1). The further away a sample mean falls from the population mean, the less the original 95% CI will capture replication means. The population mean is never known and can only be estimated.
- When population variance is not known and sample standard deviation is used to estimate population variance, the percentage of replication means that fall within a given original 95% CI varies even more widely.
- Thinking about replicating means using p values is more complicated: One way is to consider the average percentage of replication means that fall on the same side of a chosen point null hypothesis (since p values are relative to a chosen point null hypothesis). This is “an average of all possible values of the population mean, the weights for the average being the likelihoods that the various population mean values give the originally observed p value” (p 225 of paper, col 2, para 1).
Figure 1: Three examples of a 95% CI and the sampling distribution (SampDist) of replication means, for a Normal population assuming population mean and variance are known (shown at far left). Each panel shows the original mean (OM) and 95% CI of the original sample, and the sampling distribution of all possible replication means. Grey shading indicates the percentage of replication means that fall within each original CI. It is clear that the percentage of replication means that fall within an original CI depend on how closely the original mean falls to the population mean, and how much the replication means vary about the original mean. In real life, the population mean and variance are not known and only the original mean and CI can be displayed. (Figure reproduced from Figure 2 of paper)
So, my original idea was correct: a narrow 95% CI indicates the population mean was estimated precisely. However, a single 95% CI would only capture a fraction of replication means because of variability of both the original and replication means about the true mean. Personally, I still can’t wrap my head around quantifying reproducibility using p values, apart from thinking that p values don’t indicate reproducibility well.
If you are going to follow the principles of reproducible research, think carefully about the size and variability of the effect you are studying, and test enough subjects to be reasonably sure you can accurately find it.
Summary
A 95% CI indicates how precisely a sample statistic estimates the population parameter. In any experiment, sampling variability can be sufficiently large and influential that findings from replication studies differ considerably from the original study. 95% CI are more useful than p values to interpret or determine level of tolerance to lack of reproducibility.
Reference
Cumming G and Maillardet R (2006) Confidence intervals and replication: Where will the next mean fall? Psychological Methods 11:217-227.
