Why most published findings are false: revisiting the Ioannidis argument

It has been more than a decade that Ioannidis published his paper entiled Why most published research findings are false. Forstmeier et al. (2016) recently revisited the Ioannidis argument, and I thought it worthwhile to prepare a blog post on the topic to cement my understanding.
Looking for a novel effect
Let’s consider 1000 hypotheses we might want to test. Given that novelty is a key criteria to publish results, it would not be unreasonable that only 10% of these hypotheses were in fact true.

Of the 1000 hypotheses tested, 10% are in fact true.
alpha and false-positive findings
By setting 
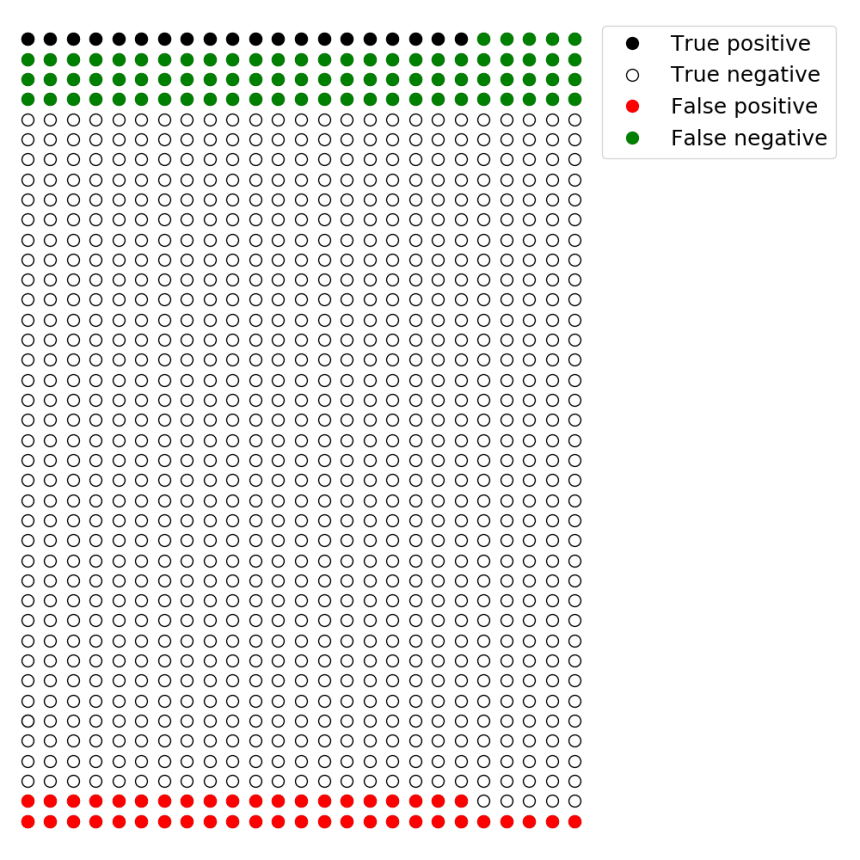
There are 100 hypotheses that are true and 900 that are not. With

With alpha set to 0.05, 5% of the 900 hypotheses that are not true will have p-values below 0.05. Thus, 45 tested hypotheses will be statistically significant when they are in fact not true (i.e., false-positives)
beta and false-negative findings
In statistics, beta represents the chance of making a type II error; i.e., false negative findings.
beta is equal to the statistical power of a study, with 80% power being a common target for studies. As previously discussed, statistical power depends on the sample size, the variability in the data and the size of the studied effect.
With 

With beta = 20%, 80% of the hypotheses that are true will have p-values below 0.05. These are true positives. This also means that 20% of the hypotheses that are true will have p-values above 0.05; these are false-negatives. With 100 true hypotheses, 80 of them will be statistically significant.
The crux of the Ioannidis argument
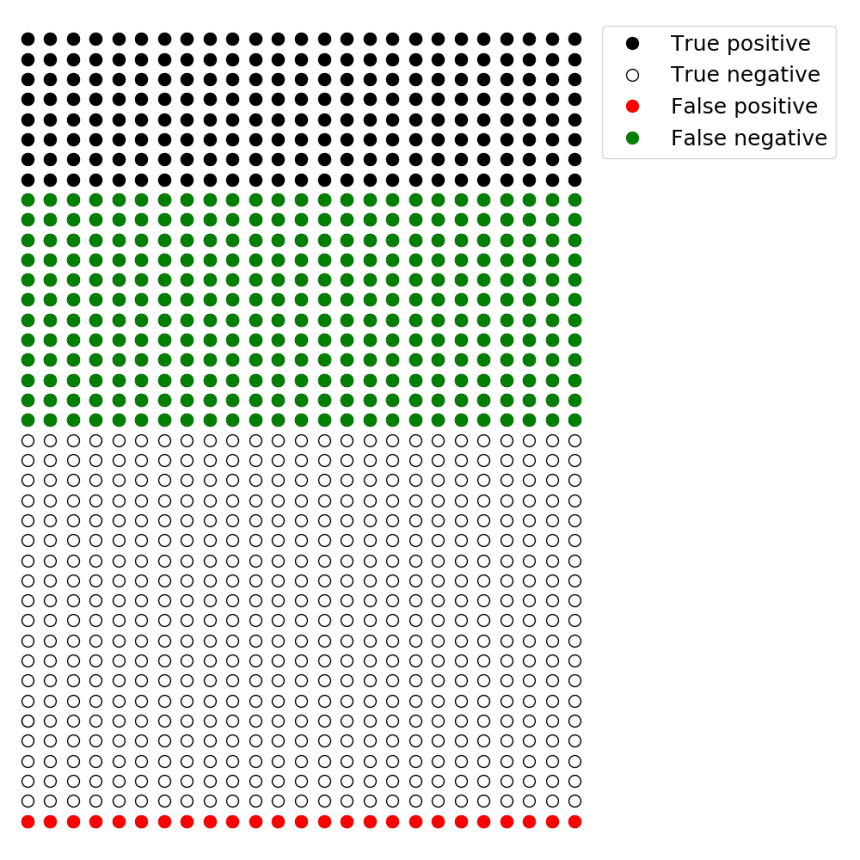
In our current example, we saw that 45 significant results were produced when we tested the 900 hypotheses that were not true (because 

What is the percentage of statistically significant hypotheses that are false? This is known as the false-positive report probability (FPRP).


This means that with
The consequence of low statistical power
As we have previously discussed, studies in neuroscience are often underpowered. That is to say, they have beta values much greater than 20%. In fact, studies can have
If we continue with our previous example, but now have 

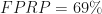
With beta = 80%, 20% of the hypotheses that are true will have p-values below 0.05. These are true positives. This also means that 80% (!) of the hypotheses that are true will have p-values above 0.05; these are false negatives. With 100 true hypotheses, only 20 of them will be found to be statistically significant. When we also consider that we will also discover 45 false positive effects (5% of 900), the false-positive report probability will be 69%
The effect of low statistical power on the the false positive report probability is obviously less for intermediate values. For example, a study with with a statistical power of 40% (i.e., 
How the likelihood of a hypothesis effects the chance of false-positive findings
Many true effects to be discovered
The previous example of 1000 hypotheses considered a typical situation where true effects are unlikely, only 10% were true. If we work in a field where half the studied hypotheses are in fact true, the chance of reporting a false positive decreases greatly.
The example below considers a field of research that is underpowered, with 


-
With beta = 60%, 40% of the hypotheses that are true will have p-values below 0.05. These are true positives. With only 10 true hypotheses, 4 of them will be found to be statistically significant. Given that alpha = 0.05, 5% of the hypotheses that are false will be statistically significant. This means there will be 50 false positives. Thus, the false-positive report probability will be 93%.
- With beta = 60%, 40% of the hypotheses that are true will have p-values below 0.05. These are true positives. With 500 true hypotheses, 200 of them will be found to be statistically significant. Given that alpha = 0.05, 5% of the hypotheses that are false will be statistically significant. This means there will be 25 false-positives. Thus, the false-positive report probability will be 11%
Few true effects to be discovered
In a field where the vast majority of hypotheses are false, the chance that a discovery is in fact a false positive is extremely high. Such fields are in search of extremely novel, and thus improbable results.
If we repeat the above example (


Summary
If science followed common statistical guidelines, the threshold for statistical significance would be set to
The Ioannidis argument also highlights the influence of underpowered studies and the search for novel but unlikely discoveries on the likelihood that a statistically significant result is in fact true.
Since it was initially published, numerous researchers have pursued the line of thinking presented by Ioannidis (2005). An important concept that we will visit in our next post is the influence of p-hacking and research flexibility on the chance that a statistically significant result is in fact false.
Reference
Forstmeier W, Wagenmakers EJ, Parker TH (2016. Detecting and avoiding likely false-positive findings – a practical guide. Biol Rev Camb Philos Soc. doi:10.1111/brv.12315 [Epub ahead of print].
Ioannidis JP (2005). Why most published research findings are false.. PLoS Med 2:e124.
