Causation 1c: ‘Association’ vs ‘causation’

Recap of Causation 1a and Causation 1b: We would like to make causal statements of how exposures (or treatments) cause outcomes. To do so, we need to know what outcome occurs when a person is exposed to something, vs what outcome occurs when the person is NOT exposed to the same thing. These separate outcomes of "what could happen" are known as potential outcomes or counterfactuals (counter to the fact, since one of the outcomes might not actually occur). The fundamental problem in causal inference is that we can’t observe individual causal effects because counterfactual outcomes are missing. However, sometimes we can observe average causal effects from groups of people.
Hypothetical counterfactual outcomes vs real life observed outcomes
Table 1.1 shows the hypothetical counterfactual outcomes of a population of 20 people if they were exposed to eating or not eating leftovers.
Table 1.1 (Reproduced from Causation 1a.)
| Person | Outcome if person ate leftovers | Outcome if person did not eat leftovers |
|---|---|---|
| 1 | sick | sick |
| 2 | sick | sick |
| 3 | sick | sick |
| 4 | sick | sick |
| 5 | sick | sick |
| 6 | not sick | sick |
| 7 | not sick | sick |
| 8 | not sick | sick |
| 9 | not sick | sick |
| 10 | not sick | sick |
| 11 | sick | not sick |
| 12 | sick | not sick |
| 13 | sick | not sick |
| 14 | sick | not sick |
| 15 | sick | not sick |
| 16 | not sick | not sick |
| 17 | not sick | not sick |
| 18 | not sick | not sick |
| 19 | not sick | not sick |
| 20 | not sick | not sick |
Hypothetically, we could observe that:
- If all 20 people ate leftovers, 10 people would be sick; the risk of getting sick from eating leftovers is 10/20 = 0.5.
- If all 20 people did not eat leftovers, 10 would still be sick; the risk of getting sick from NOT eating leftovers is 10/20 = 0.5.
In real life, since we only ever observe one exposure and its outcome in a person, we could only have data that look like this:
Table 1.2
| Person | Exposure | Outcome |
|---|---|---|
| 1 | ate leftovers | sick |
| 2 | ate leftovers | sick |
| 3 | ate leftovers | sick |
| 4 | ate leftovers | sick |
| 5 | ate leftovers | sick |
| 6 | ate leftovers | sick |
| 7 | ate leftovers | sick |
| 8 | ate leftovers | not sick |
| 9 | ate leftovers | not sick |
| 10 | ate leftovers | not sick |
| 11 | ate leftovers | not sick |
| 12 | ate leftovers | not sick |
| 13 | ate leftovers | not sick |
| 14 | did not eat leftovers | sick |
| 15 | did not eat leftovers | sick |
| 16 | did not eat leftovers | sick |
| 17 | did not eat leftovers | not sick |
| 18 | did not eat leftovers | not sick |
| 19 | did not eat leftovers | not sick |
| 20 | did not eat leftovers | not sick |
In real life, we observe that:
- Of the 13 people who ate leftovers, 7 got sick; the risk of getting sick from eating leftovers is 7/13 = 0.54
- Of the 7 people who did not eat leftovers, 3 got sick; the risk of getting sick from NOT eating leftovers is 3/7 = 0.43
What ‘association’ means
In our example, we are interested in the causal effect of eating leftovers on getting sick. People develop an outcome (sick or not sick) depending on their exposure to leftovers (ate or did not eat leftovers). To get the causal effect, we compare the proportion of people who got sick when exposed to eating leftovers, to the proportion of people who got sick when NOT exposed to eating leftovers.
What does it mean for an exposure to be associated with an outcome?
When the proportion of people who develop an outcome when exposed to something = the proportion of people who develop the outcome when NOT exposed to the same thing, we say that
- the exposure and outcome are independent, or
- the exposure and outcome are not associated, or
- the exposure does not predict the outcome.
In contrast, when the proportion of people who develop an outcome when exposed to something ≠ the proportion of people who develop the outcome when NOT exposed to that thing, we say that
- the exposure and outcome are dependent or
- the exposure and outcome are associated.
It would be useful to have a more general way of stating what association means, that could be applied to continuous or binary outcomes. Measures of effects such as the risk difference, risk ratio, odds ratio or mean difference (and other measures) quantify the strength of association when it is present. Measures of effects are sometimes called expectations (i.e. the quantity we’d expect to get). So, more generally: an association exists when an expectation when a group of people is exposed to something ≠ the expectation when the group of people is NOT exposed to that thing.
‘Assocation’ vs ‘causation’
Table 1.1 shows counterfactual outcomes when a whole population is exposed or NOT exposed to something. Because the risk of the outcome in those exposed (0.5) = the risk of the outcome in those NOT exposed (0.5), there is no causal association between exposure and outcome (i.e. the exposure did not cause the outcome).
In contrast, Table 1.2 shows observed outcomes when parts of a population are exposed or not exposed to something. Here, the risk of the outcome in those exposed (0.54) ≠ the risk of the outcome in those NOT exposed (0.43). So there IS an association between exposure and outcome.
But is this association causal? Not necessarily. For example, the people who ate leftovers might have been older and more frail, and were more likely to get sick than those who did not eat leftovers. So the association between eating leftovers and getting sick could have been confounded by frailty.
So, causation is defined by different risks in the same population under different counterfactual exposures. But association is defined by different risks in subsets of the population, determined by people’s observed exposures (Fig 1.)
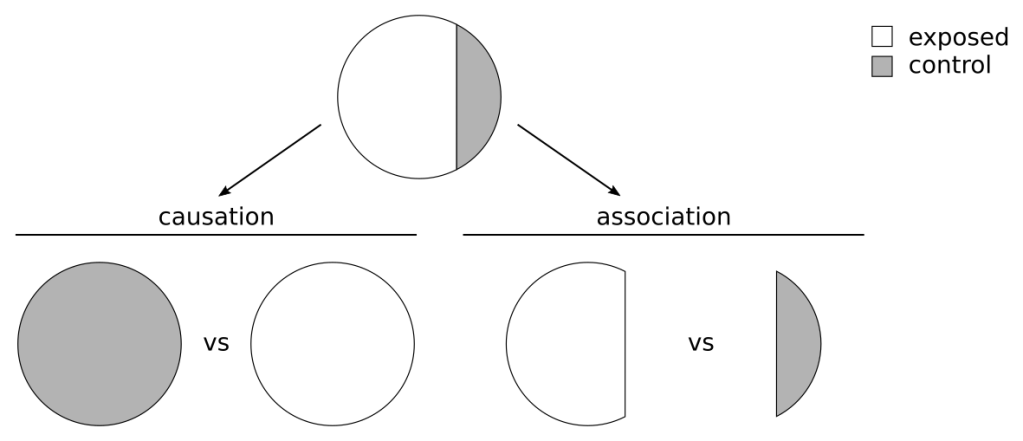
Fig 1. Causation involves comparing outcomes when a whole population is exposed vs the whole population is NOT exposed. Association involves comparing outcomes when part of the population is exposed vs a different part of the population is NOT exposed. Other exposures could account for why these subsets of the population are different. Adapted from Fig 1.1, Hernán MA, Robins JM (2020).
This example explains the well-known saying "association is not causation". But importantly, association is needed for exposures to cause outcomes.
Summary
An exposure is associated with an outcome when a proportion, mean difference, or some other expected value when a group of people is exposed to something ≠ the expected value when the group of people is NOT exposed to that thing.
Obtaining causal effects involves comparing outcomes when a whole population is exposed vs the whole population is NOT exposed. Association involves comparing outcomes when part of the population is exposed vs part of the population NOT exposed. Other factors could explain why an exposure seems associated with an outcome.
Association is not causation, but association is needed for causation.
Reference
Hernán MA, Robins JM (2020). Causal Inference: What If. Chp 1.5. Boca Raton: Chapman & Hall/CRC.
See also: Table of contents
