R: Analysing small datasets – Part 1

Experimental studies are often based on relatively small samples. It is always better to test more subjects where possible, but even if the final dataset is comparatively small we should still strive to analyse the data properly.
Let’s look at one way to analyse a small dataset. We will analyse data from the sleep dataset available in R. The sleep dataset contains data on number of hours of sleep from 10 subjects after taking 2 types of drugs.
1 2 3 4 5 6 7 8 9 10 11 12 13 14 15 16 17 18 19 20 21 22 23 24 25 26 27 28 29 30 31 32 33 |
# R version: 3.2.3 on Linux Mint 18.
# install packages: comment out line below if packages are installed
install.packages('ggplot2')

# load libraries
library(ggplot2)

# set user working directory
setwd('/home/joanna/Dropbox/')

# load datasets, assign sleep dataset to dataframe df
require(stats)
df <- sleep
print(df)

# plot scatterplot of subject repeated measures
fig <- ggplot(df, aes(x=group, y=extra, group=ID)) +
  geom_point(aes(color=ID), size=5, position=position_dodge(width=0.05)) +
  geom_line(size=1, alpha=0.5) +
  xlab('Drug') +
  ylab('Extra sleep (hour)') +
  theme_bw() +
  theme(axis.line = element_line(colour="black"),
        panel.border = element_rect(colour="black", size=1),
        panel.grid.major = element_blank(),
        panel.grid.minor = element_blank(),
        panel.background = element_blank(),
        text = element_text(size=18))
print(fig)
# save figure
png(filename="repeated.png", width=11, height=7, units='in', res=300)
plot(fig)
dev.off()
|
Line 11-14. Read in the sleep dataset, assign it to the object df (for dataframe) and print out the dataframe to check the data structure.
We see that data are organised into a dataframe with 3 columns: extra is numeric data on increase in no. of hours of sleep, group is factor data (ie. categorical data) on whether the subject took drug 1 or 2, and ID is factor data of the subject identifier. The data are in long format: repeated observations from each subject are written on separate rows, linked to the subject’s unique identifier, so that each subject has data over more than 1 row.
For any dataset, the first thing to do is to plot the raw data and see how individual subjects respond:
Line 16-33. Plot hours of sleep for each subject after taking drug 1 or 2, and save the plot in the working directory. Plotting a graph in R involves calling a plotting function then gradually extending it to refine the graph.
We call ggplot, pass the dataframe df and specify the aesthetics to plot hours of sleep on the y axis (extra) on type of drug on the x axis (group) for each subject (ID). Call geom_point to plot each subject’s value as a dot and coloured by subject ID, and make the points scatter a little so we can see individual points even if there is overlap (position_dodge()). Call geom_line to plot a line linking the same subject’s value for drug 1 and 2. Give the x and y axes labels (xlab, ylab) and specify a minimalist black-and-white theme for the overall plot (theme_bw()). Within this theme, specify a bunch of other parameters eg. remove internal gridlines, change text size, etc.
The code generates the following Figure 1:
Figure 1:
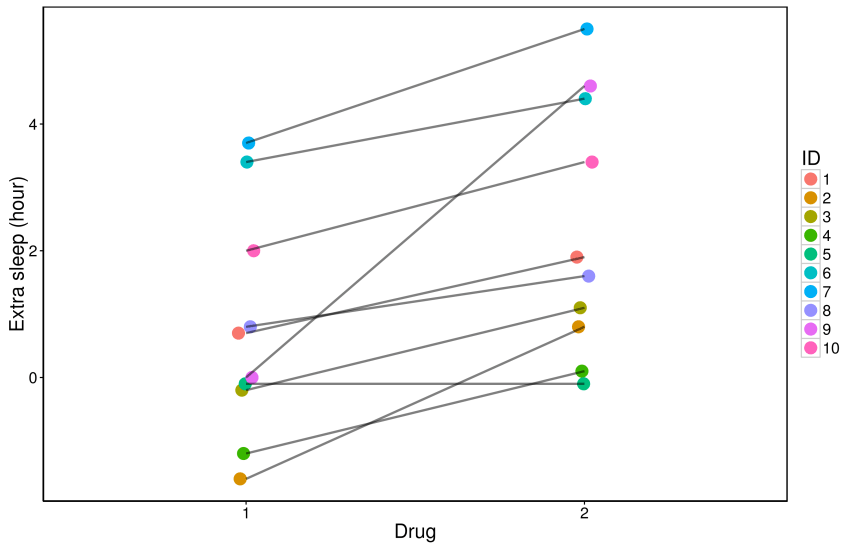
There seems to be a reasonable trend that subjects get more hours of sleep after taking drug 2 compared to drug 1. (This dataset does seem pretty but if you have seen raw data enough times, you will realise data are often much more variable than this!) Since there are few data points, we could plot boxplots indicating median and interquartile range (IQR) values, together with the raw data. In the next installment we will discuss what medians are, and see how to plot boxplots together with raw data.
Summary
We loaded an R dataset containing repeated measures data from 10 subjects and plotted the raw data to check how individual subjects respond to different conditions. Next, we will replot the raw data with summary boxplots of medians and IQRs.
